Though there are numerous software options available to help you keep track of your fair lending focal points, Excel can be a powerful tool if you know how to use it. Follow these easy steps to keep track of your loan products using a pivot table.
What is a Focal Point?
Fair Lending Focal Points are Each Potential Combination of “Loan Product(s), Markets(s), Decision Centers(s), Time Frame, Prohibited Basis and Control Groups.
- Loan Product: Unique Combination of Loan Type, Loan Purpose, Property Type, Lien Status, Occupancy
- Markets: MSAs
- Decision Centers: Usually NA
- Time Frame: Application Date or Action Date
- Prohibited Basis Groups: American Indian/Alaskan Native, Asian, Black, Hawaiian/Pacific Islanders, Females, Age>=62, Hispanics (Other Possible Prohibited Basis Groups: Minority Tracts, MSAs, Applicant Income Groups)
- Control Groups: White Non-Hispanics ( in Race/Ethnicity Analyses), Females (in Gender Analyses)
How To Find All Focal Points
1. Identify All Focal Points
2. Filter All Focal Points
- High Loan Volume
- Large Number/Percent of Protected Basis Applicants
- Previous Exam Results
- Good Data
- Compliance Program
3. Filter Focal Points Further Based on Risk Factors Import Your HMDA data into an Excel Spreadsheet

4. Insert Pivot Table

5. Place Focal Point Pivot Table in an Excel Spreadsheet

6. Build the Focal Point Pivot Table

7. Customize Focal Point Pivot Table

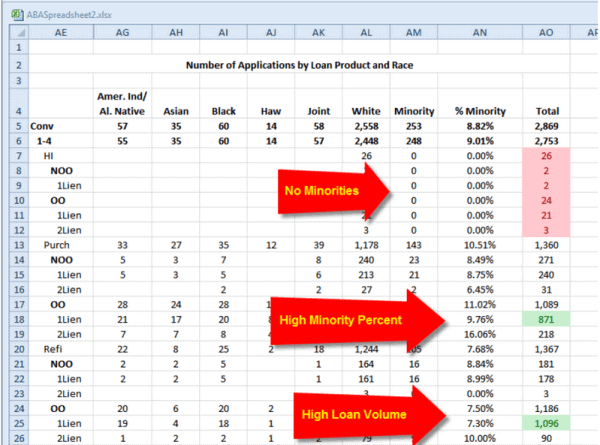
8. Filter Focal Points (Minority Percent, High Loan Volumes)

How To Assess Focal Points for Risk
What Are Your Fair Lending Focal Point Risk Dimensions?
- Underwriting
- Pricing
- Steering
- Redlining
- Foreclosures/Loan Mods
- Small Business
Most Frequently Analyzed Risk Dimensions for Institutions
- Residential/Consumer Markets (Traditional: Underwriting and Pricing) vs (New: Steering and Redlining)
- What Risk Dimensions are Relevant, Given Your Bank’s Business Model?
Presentation Examples Focus On:
- Underwriting
- Pricing
- Redlining
- Steering
Underwriting Pivot Table
 Underwriting Pivot Table with Statistics

- T-Value Cutoffs: +/- 1.96 for 95% Confidence Interval
- Risky Segments: Hawaiians/Pacific Islanders
Pricing Incidence
1. Create Y/N Column Spreadsheet Data: =IF(Rate_Spread>0, ”Yes”, “No”)

2. Create Percent Table

3. Generate Pivot Table with Statistics

Steering Analysis

Steering Analysis with Statistics

Statistically Significant Segments: None Redlining
1. Create Pivot Table 
Risk Indicator Analysis: 
Conclusion
Fair Lending Risk Assessments Are Important
- Regulators Expect to See Them
Institutions of All Sizes Can Use Excel To Do Their Risk Assessments
- No Software Investment
- Familiar Software / No Training Needed
- Easy to Automate Using Macros
- Useful for Quick Analyses, Even If You Have Software
See Your Fair Lending Exam Procedures for Additional Analyses